-
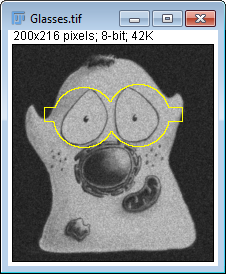
Regions of Interest (ROIs) can be manually drawn and measured
-
The accuracy of measurements will depend upon the Image Properties being correct
-
Multiple ROIs can be added to the ROI Manager or an overlay
-
ROIs can be inverted or combined to give more complex shapes
Measurements & regions of interest
Measuring images
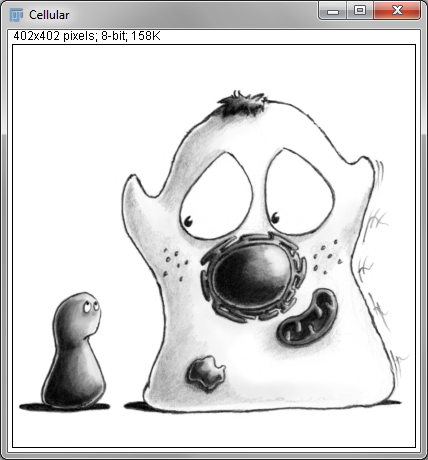
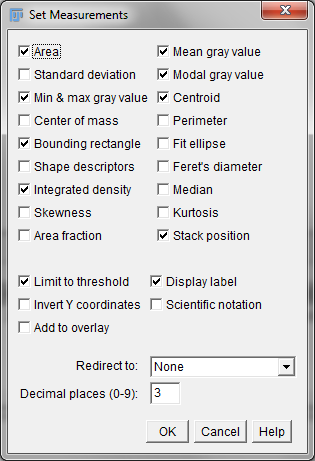
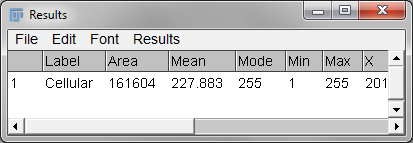
The main command for measuring in ImageJ is found under (or just press M), where determines what measurements are actually made. Possibilities include areas, perimeters, lengths, and minimum, maximum and mean pixel intensities (here referred to as 'gray values'), as well as further measurements of shapes or intensities (Figure 1B). By default, measurements are made over the entire area of the currently-selected 2D image slice, and added to a results table (Figure 1C).
Regions Of Interest
Usually we want to measure something within an image and not the whole
thing. Regions Of Interest (ROIs) can be used to define specific parts
of an image that should be processed independently or measured, and so
only pixels within any ROI we draw will be included in the calculations
when we run Measure.
ROIs of different types (e.g. rectangles, circles, lines, points, polygons, freehand shapes) can be drawn using the commands in the tool bar (Figure 2), and are invariably 2D. Right-clicking the tools often provides access to related tools, while double-clicking may give additional options. When drawing a ROI, pressing Shift or Control before releasing the mouse button adds the ROI being drawn to any existing ROI already present.
Some extra commands to create or adjust ROIs appear under the submenu, which we will make more use of later.
Working with multiple regions
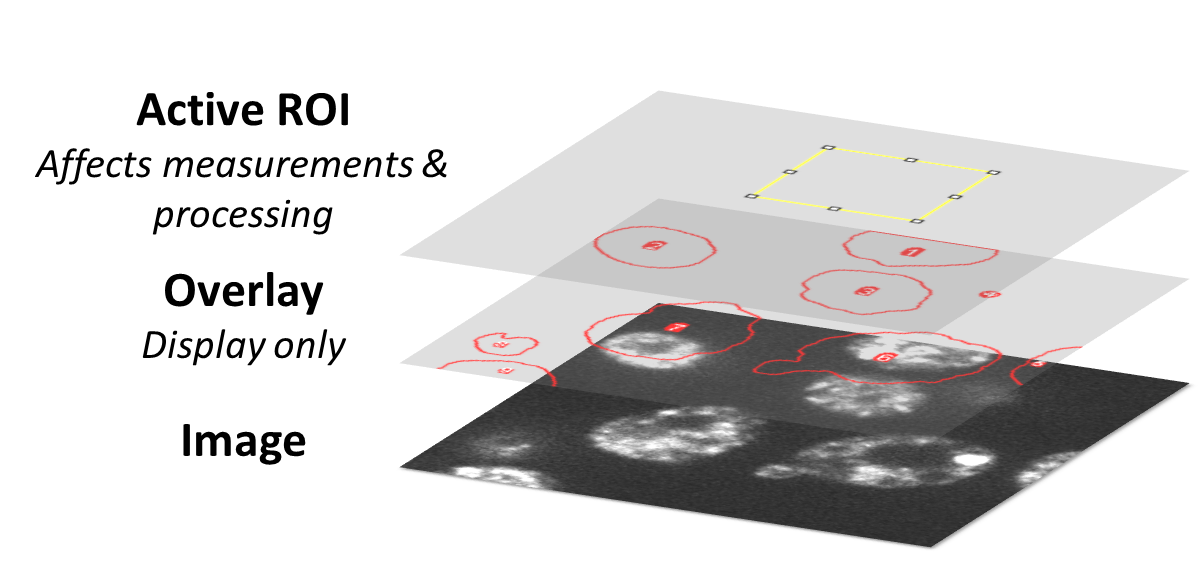
Normally, only a single ROI can be 'active' (i.e. affecting measurements) at any one time. If you need control over multiple ROIs, there are two places in which you can store them, differing according to purpose:
-
The ROI Manager: for most ROIs that you want to be able to edit and use for measurements
-
The image overlay: for ROIs that you only want to display
The ROI Manager
The ROI Manager provides a convenient way to store multiple ROIs in a
list, allowing you to easily access, edit and measure them. The slow way
to open it is to choose . The fast way
is just to draw a ROI and press T[1]. The additional Measure command within the manager is then
like applying to each ROI in turn. If you happen to
want to show all the ROIs simultaneously, you can select the Show All
option[2].
Because ROIs in the ROI Manager are represented independently of the image on which they were defined, you can create a ROI on one image, add it to the ROI manager, select a different image and then click on the ROI in the ROI Manager to place it on the second image. Measurements made from the ROI Manager always use the most recently-selected image, so be careful if you have several images open at the same time.
Overlays
Overlays also contain a list of ROIs that are shown simultaneously on
the image, but which do not affect the Measure command. They are
therefore suitable for storing annotations for visualization purposes. You can think of them as
existing on their own separate layer, so that adding and removing the
overlay does not mess up the underlying pixel values
(Figure 3). The relevant commands are found in the
submenu, where you can get started by drawing a ROI
and choosing Add Selection (or simply press B[3]). The same submenu also provides commands to transfer
ROIs between the overlay and the ROI Manager.
Saving ROIs
Individual ROIs can be saved simply by choosing
The ROI Manager itself has a Save…
command (under More), which will save whichever ROIs are currently
selected (or, if none are selected, all of them). Overlays are fixed to
specific images and do not have their own special save command, but will
nonetheless be included if you save the image as a TIFF file (ImageJ’s
default format). Any currently-active ROI will also be saved in a TIFF.
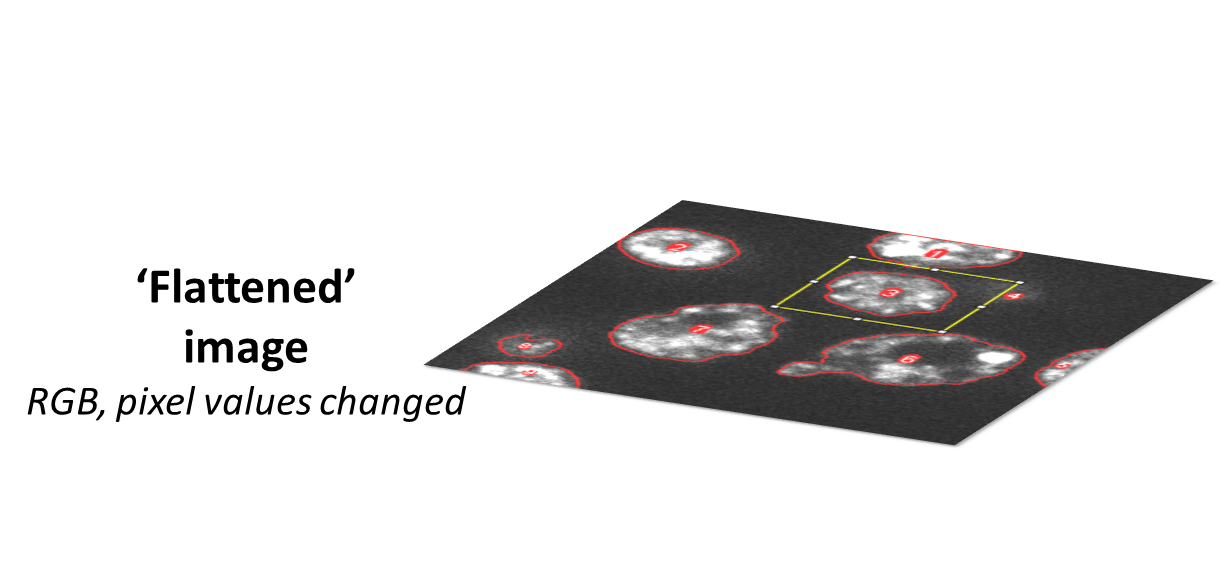
This is fine if you work only in ImageJ or Fiji, but unfortunately if you try to view your ROIs in other software it is highly unlikely to work properly, since the format is specific to ImageJ. The way around this is to use the command. This creates an RGB copy of the image in which the pixel values have been changed so that any ROIs or overlays will appear whenever you open the image elsewhere. Therefore you may well want to use this command when creating figures or presentations, but you do not want to subsequently apply your analysis to the image you have flattened – always use the original instead.
For more details on the impact of converting an image to RGB, see Channels & colors.
