-
Images with multiple color channels may display differently in different software
-
RGB images are a special case, and these look consistent across different software
-
In ImageJ, multichannel images that are not RGB may be referred to as composite images
-
Conversion of composite to RGB often loses information!
Channels & colors
Chapter outline
Different kinds of color image
One way to introduce color into images is to use a suitable LUT, as described in Images & pixels. However, then the fact that different colors could be involved in the display of such images was really only incidental: at each location in the image there was still only one channel, one pixel and one value.
For images in which color is more intrinsic – that is, when the channel number is an extra dimension (see Dimensions) and we want to display channels superimposed on top of one another – things become more complex, because the precise color in the display for one location now depends upon a combination of multiple pixel values mixed together.
There are two main types of color image we will consider in this chapter, and it is important to know the difference between them:
-
Multichannel / composite images – good for analysis, since they can contain the original pixels given by the microscope, but may appear differently (or not be readable at all) in some software
-
RGB images – good for display, because they have a consistent appearance, but often unsuitable for quantitative analysis because original pixel values are likely to be lost
Multichannel images
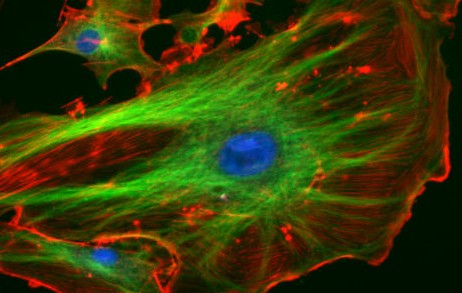
We consider a 'true' multichannel image here to be one in which the channel number is an extra dimension. Pixel values for each channel are often determined from light that has been filtered according to its wavelength. In principle, any LUT might be applied to each channel, but it makes sense to choose LUTs that somehow relate to the wavelength (i.e. color) of light detected for the corresponding channels. Channels can then be overlaid on top of one another, and their colors further merged for display (e.g. high values in green and red channels are shown as yellow).
The important feature of these images is that the actual channel information is always retained, and so the original pixel values remain available. This means you can still extract channels or adjust their LUTs as needed.
Composite images in ImageJ
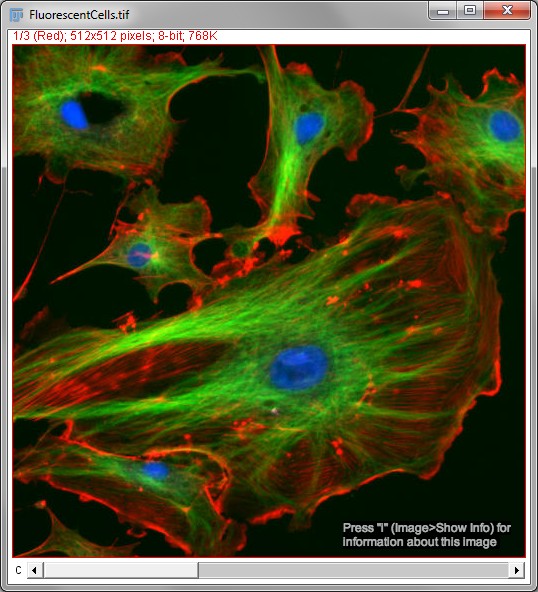
A: Composite image
|
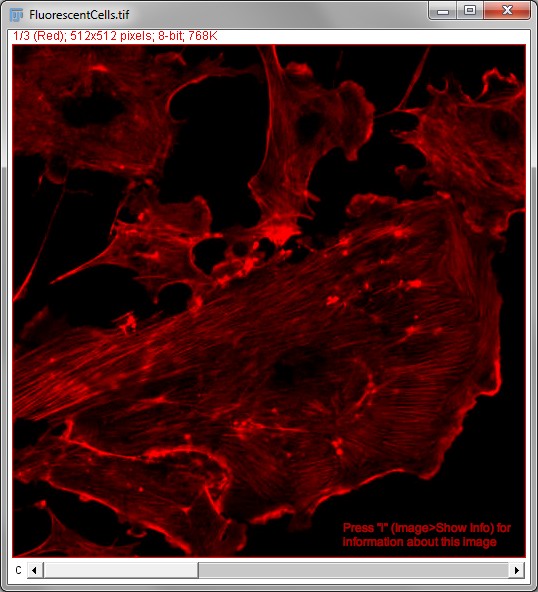
B: Red channel
|
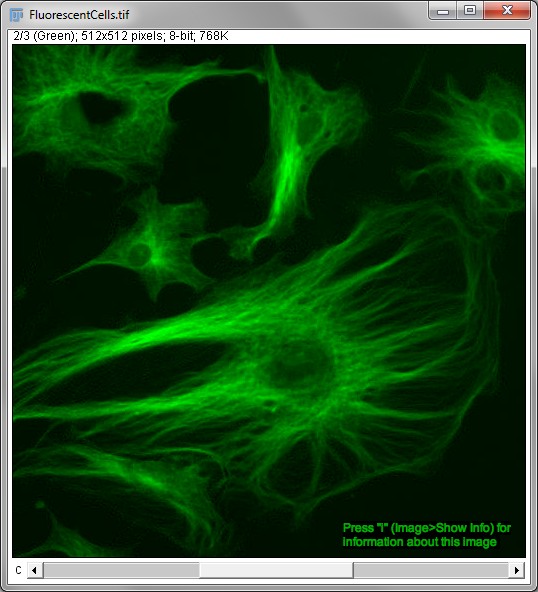
C: Green channel
|
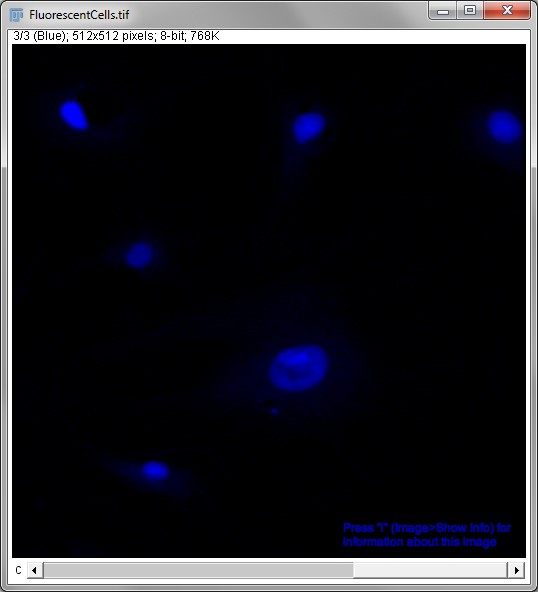
D: Blue channel
|
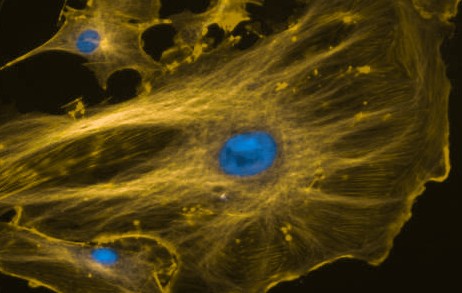
Figure 1:
ImageJ composite image sample Fluorescent Cells.
Using the Channels Tool… and the slider at the bottom of the window, you can view the channels individually or simultaneously.
In ImageJ, such representations of multiple channels are sometimes known
as composite images. An example can be opened by selecting
(Figure 1). As you move the slider at the bottom of
the image, it might not look like much is happening. But if you also
open the Brightness/Contrast… tool you can see that the color of the
histogram changes for each slider position. Adjusting the contrast then
adjusts it only for the current channel. This is very useful because
quite different contrast settings can be required for each channel to
get a decent final appearance. Also, as you move the mouse over the
image the 'value' shown in the status bar is the pixel value only for
that channel.
Composite images allow us to see multiple channels at the same time. But sometimes this masks information and it helps to look at each channel individually. One way to do this is to choose , which will give you separate images for each channel. But a more powerful option is to select .
RGB images
Composite images can contain any number of channels, and these channels can have any of the bit-depths ImageJ supports (see Types & bit-depths) – so long as all channels have the same bit-depth. By contrast, RGB images invariably have 3 channels, and each channel is 8-bit[1]. Furthermore, the channel colors in an RGB image are fixed to red, green and blue.
This already makes clear that composite images can (at least potentially) contain much more information. However, the inflexibility of RGB images has one important advantage: compatibility. Computer monitors generate colors for display by mixing red, green and blue light. RGB images can dictate directly how much of each color should be used. This means that the values in each RGB channel really do determine the final image appearance, without any ambiguity regarding which LUTs should be applied because these are already known. Therefore all software can display RGB images in the same way.
RGB images in ImageJ
RGB images can be easily distinguished from composite images in ImageJ
both because they do not have an additional slider at the bottom to move
between channels, and because the text RGB appears at the top of the
image window in place of the bit-depth. Also, moving the cursor over an
RGB image leads to 3 numbers following the value label in the main
status bar: the pixel values for each of the channels.
Changing the brightness/contrast of an RGB image is also different.
Making adjustments using the normal Brightness/Contrast… tool leads to
the appearance of all 3 channels being affected simultaneously.
Comparison of color images
Only composite images can therefore store more than three channels, or data with a bit-depth higher than 8. Consequently, if acquisition software provides the option to save data in an RGB format, this temptation should normally be resisted – unless you also save the image in the software manufacturer’s preferred, non-RGB format, and only use this latter version for analysis[2]. The reason is that the conversion of a composite image to RGB can result in a significant loss of information, and if we only have the RGB version it may be impossible for us to say whether or not this loss has occurred.
Still, there is no way of displaying a composite image that cannot be replicated by an RGB image, because the monitor itself works with RGB data (translated to red, green and blue light). Therefore for creating figures or presentations, converting data to RGB is a very good idea for the compatibility advantages it brings. In the end, it is normal to need to keep at least two versions of each dataset: one in the original (multichannel / composite) format, and one as RGB for display. This RGB image is normally created as the final step, after applying any processing or LUT adjustments to the original data.
Other color spaces
Since monitors work with RGB images, in practice what you are actually seeing on screen is always an RGB image – even when we are actually working with the data in a composite image. The RGB version is just quietly made in the background based on the composite data so that the monitor can give us something to look at. If we convert the composite image to RGB we then basically just throw away all the extra useful information the composite contained, and keep only the displayed version.
However, there are more ways to represent colors than just mixtures of red, green and blue light. One familiar example is using cyan, magenta, yellow and black ink – leading to a CMYK representation of color. In practice, fewer colors can be faithfully reproduced using CMYK when compared to RGB, which is one reason why printed images often do not seem to have quite the same colors as the same images on screen.
The other main color representation that turns up in ImageJ is HSB, which stands for Hue, Saturation and Brightness. An RGB image can be converted to HSB using . In practice, this representation can be useful for detecting features in color images that were originally RGB (e.g. conventional photographs, or some brightfield images), but it is largely irrelevant for fluorescence microscopy.
Choosing channel colors
By changing the LUTs, channels can be assigned any color you like. Although red/green images are widespread, especially for colocalization, they are particularly unhelpful for colorblind people. More accessible images can be created by switching the LUTs of at least one channel to something more suitable (e.g. Red → Magenta) – although displaying both channels separately is better still.
You can also test the effects of different colors using the Fiji command (note that this may require converting the image to RGB first).
More information about generating figures with suitable colors is available at http://www.nature.com/nmeth/journal/v8/n6/full/nmeth.1618.html.
1. This is the case in ImageJ, and usually (but not always) in other software. For example, it is possible for an RGB image to be 16-bit, and some contain an extra 'alpha' channel (which relates to transparency), and so might be called ARGB or RGBA. But such images do not often occur in science.
2. This assumes fluorescence microscopy data. For an application when RGB is often suitable, see Whole slide images.