-
Image analysis usually consists of three main stages: preprocessing, detection & measurement
-
The same basic techniques reoccur in most analysis, with their combinations & parameters tailored to the particular task
Overview: Processing & analysis
Chapter outline
The goal of analysis
Successfully extracting useful information from fluorescence images usually requires triumphing in two main battles. The first is to overcome limitations in image quality and make the really interesting image content more clearly visible. This involves image processing, the output of which is another image. The second battle is to compute meaningful measurements. This is image analysis. Except when creating beautiful figures, the ultimate goal we are most interested in here is analysis – but processing is almost always indispensable to get us there.
One way to approach image analysis is to see it like a puzzle. In the end, one hopes to extract some kind of quantitative measurements that are justified by the nature of the experiment and the facts of image formation, but there is no fixed way to go about that. This liberating realization suggests there is room for lateral thinking and sparks of creativity. Admittedly, if no solution comes to mind after pondering for a while then such an optimistic outlook quickly subsides and the 'puzzle' may very well turn into an unbearably infuriating 'problem' – but the point here is that in principle image analysis can be enjoyable. All it takes is properly-acquired data, a modicum of enthusiasm, and the good luck not to be working on something horrendously difficult.
Despite the diversity of algorithms[1] that could be constructed to analyze an image, in practice they generally tend to be built up from the following three stages:
-
(Pre)processing, e.g. subtract the background, use a filter to reduce noise
-
Detection, e.g. apply a threshold to locate interesting features, refine the detection
-
Measurement, e.g. count pixels to determine areas or volumes, quantify intensities
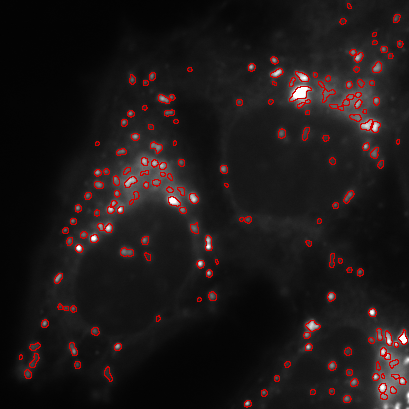
Figure 1 shows an example of how these can fit together.
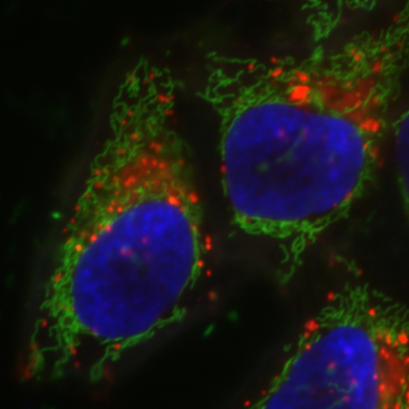
A: Original image
|

B: Extract channel
|
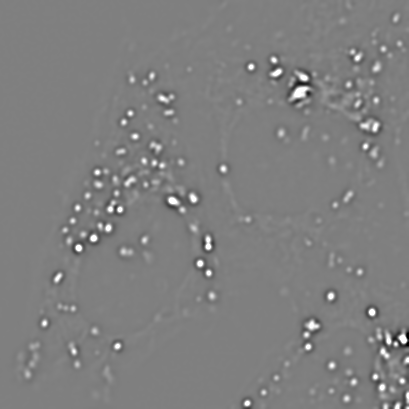
C: Apply filters
|
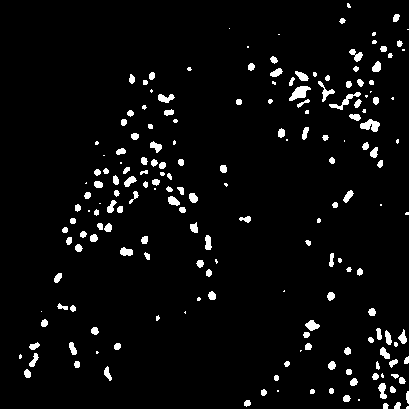
D: Apply threshold
|
||||
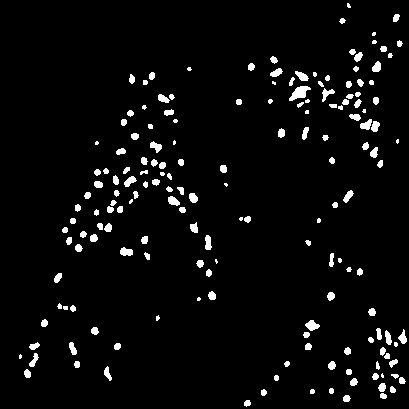
E: Refine detection
|
F: Relate (E) to (B)
|

G: Measure
|
|||||
Figure 1:
An simple image analysis workflow for detecting and measuring small spots, applied to the red channel of the sample image HeLa Cells.
Part II of this handbook provides a tour of many of the fundamental techniques that may be used for each of the three stages. Armed with only these techniques, a vast amount is already achievable: the challenge is to figure out how to string them together for whatever application you encounter. But even if you ultimately end up doing your analysis with someone else’s automated software or plugin, knowing the main building blocks of image processing and analysis can still help explain what the algorithm you use is really doing and why.
The following chapters deal primarily with 2D images. Processing data with higher dimensions then briefly discusses how the techniques can be extended into more dimensions, before Writing macros provides an introduction to creating macros that can be used to automate all or part of an analysis workflow.
1. An 'algorithm' can be considered to be simply a 'sequence of steps'.