-
The number of dimensions of an image is the number of pieces of information required to identify each pixel
-
In ImageJ, images with more than 2 dimensions are stored in a stack or hyperstack
Dimensions
Chapter outline
Identifying dimensions
The idea of image dimensions is straightforward: the number of dimensions is the number of pieces of information you need to know to identify individual pixels.
For example, in the most familiar 2D images, you can uniquely identify a pixel by knowing its x and y spatial coordinates. But if you needed to know x and y coordinates, a z-slice number, a color channel and a time point then you would be working with 5D data (Figure 1). You could throw away one of these dimensions – any one at all – and get a 4D image, and keep going until you have a single pixel remaining: a 0D image. Throw away that, and you no longer have an image.
A: 0 dimensional
|
B: 1 dimensional
|
C: 2 dimensional
|
D: 3 dimensional
|
E: 4 dimensional
|
F: 5 dimensional
|
Figure 1: Depictions of images with different numbers of dimensions. (A) A single value is considered to have 0 dimensions. (B—F) Additional dimensions are added, here in the following order: x coordinate (1), y coordinate (2), channel number (3), z slice (4) and time point (5).
In principle, therefore, 2D images do not need to have x and y dimensions. The dimensions could be x and z, or y and time, for example. But while we may play around with the identity of dimensions, the important fact remains: an nD image requires n pieces of information to identify each pixel.
Stacks & Hyperstacks
In the beginning there were 2D images. Then ImageJ supported stacks, which allowed an extra dimension that could either include different time points or z-slices – but not both. Nowadays, hyperstacks are the more flexible derivative of stacks, and can (currently) store up to 5 dimensions without getting them confused.
Navigating dimensions
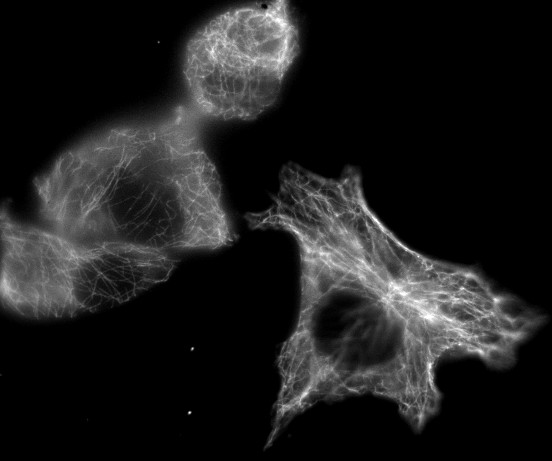
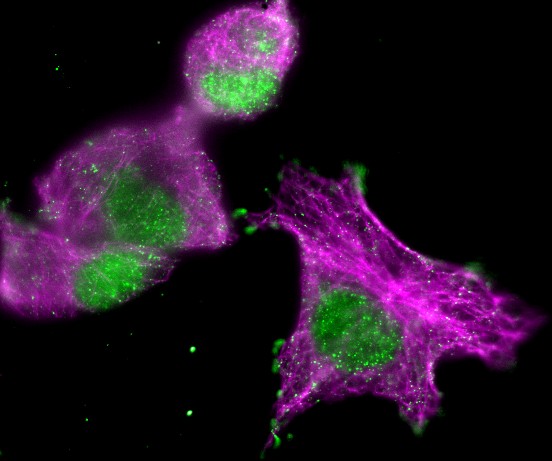
With a stack or hyperstack, only a single 2D slice is 'active' at any one time. Extra sliders at the bottom of the image window are used to change which slice this is (Figure 2). In the case of multichannel images, any changes to lookup tables are only made to slices of the currently-active channel.
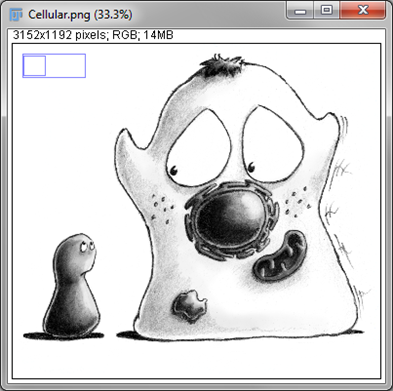
A: 2D image
|
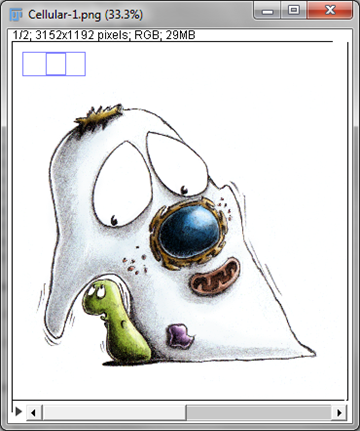
B: 3D (hyper?)stack
|
C: 4D hyperstack
|
Figure 2: Stacks in ImageJ contain 3D data, while hyperstacks contain up to 5 dimensions. Both include additional sliders, not required for 2D images, to shift along the additional dimensions and make different slices active.
Correcting dimensions
The dimensions of an image can be seen in the top entries of . Occasionally these can be incorrect: perhaps different z-slices were wrongly interpreted as time points when a file was opened, or the presence of multiple channels was not spotted. This can affect not only the display, but also some processing or measurements. Fortunately, dimensions can be corrected manually using the command – provided you know, or can work out, the right values.
Presenting dimensions
To the computer, an image is stored as a lot of pixel values, irrespective of the number of dimensions it should have. However, as the number of dimensions increases, providing a useful representation of all the values at once becomes tricky. The z dimension is most troublesome of all, because there are are relatively natural choices for channels and time points (i.e. to use different colors and to show a movie), so we will concentrate on it.
Viewing angles: your data in a box
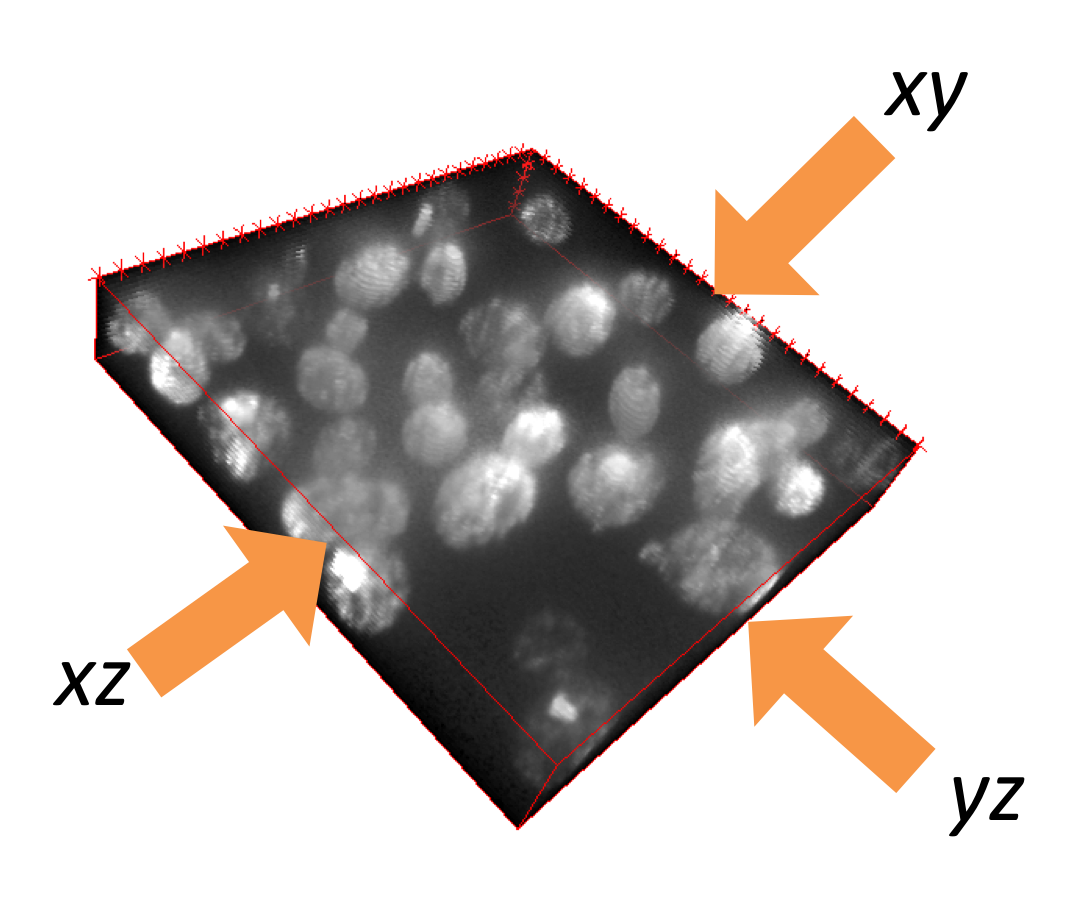
A: Volume rendering
|
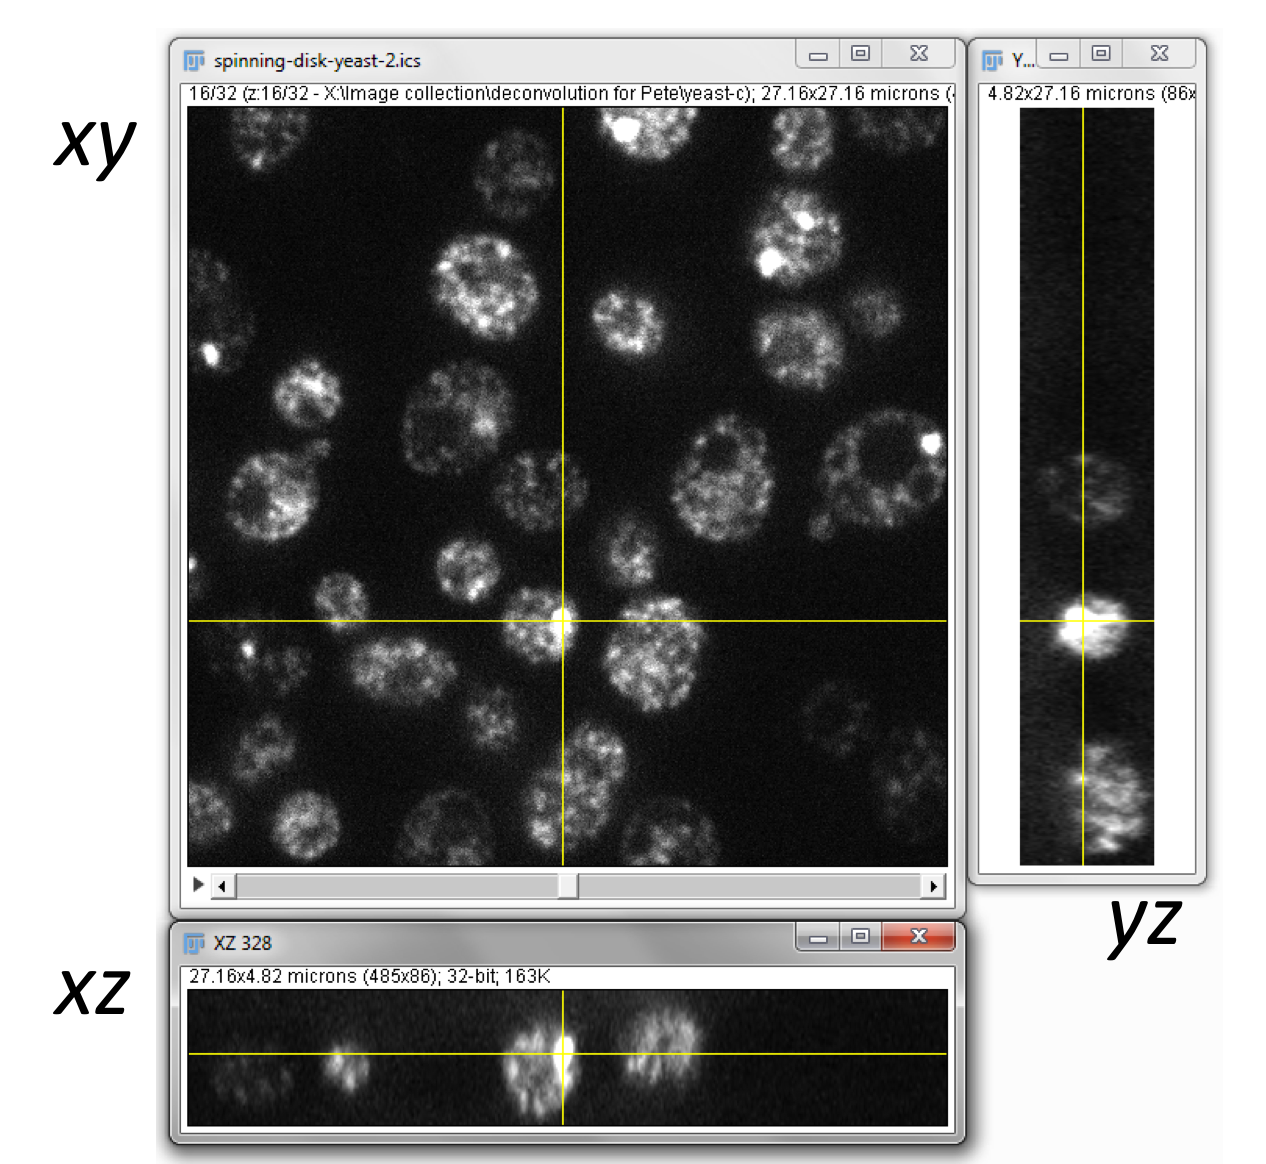
B: Orthogonal views
|
Figure 3:
Two ways to look at 3D data, using the 3D Viewer for 'volume rendering' and the Orthogonal Views command.
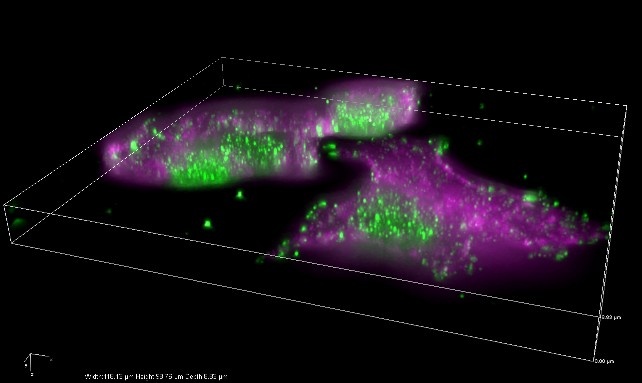
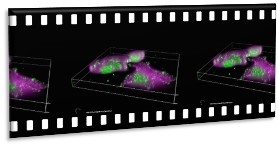
It is helpful to consider the pixels of 3D data as being densely packed into a transparent box that could be viewed from different angles (Figure 3A). Visualizations like this can be made with . They are particularly good for generating attractive figures or impressive movies, but details can be hard to interpret because they are influenced by perspective and which pixels overlap from our current viewing angle.
To systematically explore data, therefore, it is usually preferable to look inside the box by generating 2D images from only 3 angles: from above (xy) and from two remaining sides (xz and yz). These 3 viewpoints are orthogonal (i.e. they are oriented at 90 to one another), and the command makes this easy. It opens up 2 extra windows, so that when you click at any point on the original xy view, you are shown cross-sections through that point from each direction.
Reslicing
The Orthogonal Views command really only gives you a temporary look at
the data from different angles, but you do not have full control over
the extra views: you have limited influence over the brightness and
contrast, for example, and all your clicks on the images get intercepted
to update the display, which means you cannot draw regions of interest.
If you instead want to rotate the entire stack so that you can browse through what are effectively xz or yz slices and do whatever you want to them, the command you need is .
Z-projections
Another extremely useful way to collapse the data from 3 dimensions into 2 is to use a z-projection. The basic idea is of taking all the pixels in a stack that have the same x and y coordinate, applying some operation to them, and putting the result of that operation into a new 2D image at the same x and y position.
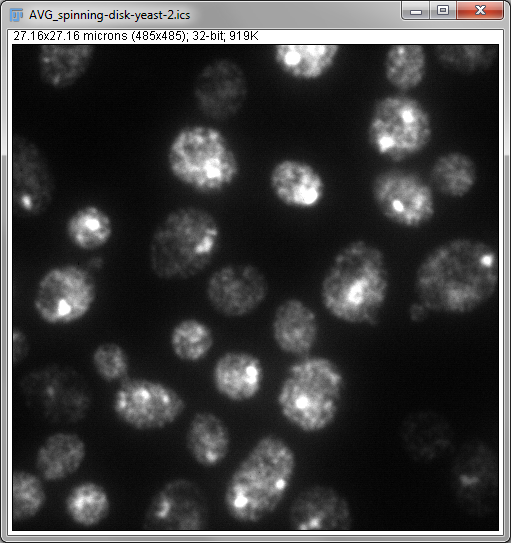
A: Sum projection
|
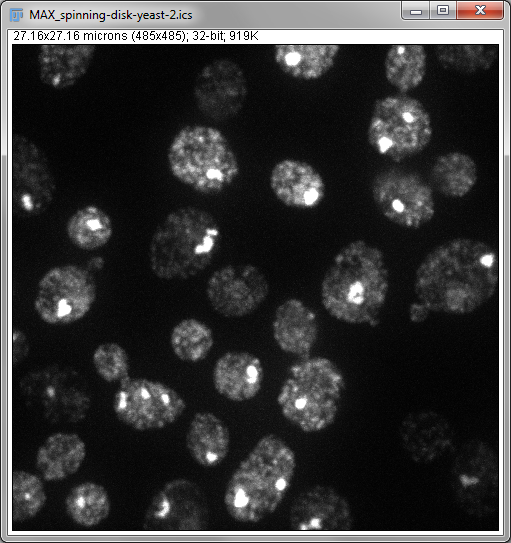
B: Maximum projection
|
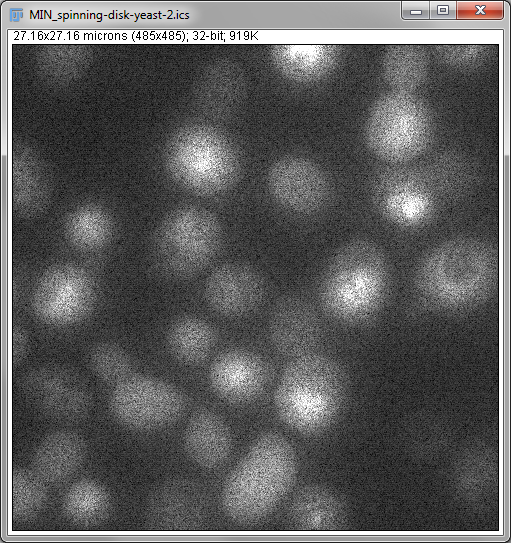
C: Minimum projection
|
Figure 4: Three projections of a z-stack. Sum projections often look similar to maximum projections, but less sharp.
Two important operations in fluorescence imaging are to add all the pixels with the same xy coordinates (a sum projection), or to compare the pixels and select only the largest values (a maximum projection), both implemented under . The advantage of the first is that every pixel value has an influence on the result: which is good if you plan to measure intensities in the projection image (although quantitative analysis of projections can be somewhat dangerous, e.g. if intensity measurements are compared between projections made from stacks with different numbers of slices). The advantage of the second is that it tends to give a nice and sharp looking image, since structures are at their brightest in the planes where they are in focus (Figure 4B). Naturally, you could make a minimum intensity projection if you liked, but a very out-of-focus-looking image is generally less desirable (Figure 4C).
Question


Shown on the right are sum and maximum projections of an image containing 3 beads: A, B and C. Which projection is which?
And which projection, if either, would be suitable for determining the pair of beads that are closest to one another?
Answer
Identifying the projections is tricky since the contrast settings could be misleading, although here they are not… Projection 1 (on the left) is the sum projection, and Projection 2 (on the right) is the maximum projection. The sum projection looks less sharp since the regions around the beads contains out-of-focus light, which becomes more obvious when all the slices are added.
As for determining the distance between beads, neither projection is
very good. Either could be used to determine the distance in
x and y, but if one bead is much, much
deeper in the stack then all information about this z
displacement would be lost in the projection. This is one reason why it
is not good to base analysis on projections alone. Orthogonal views
would help.
Practical
Z-projections are all very well, but how would you make an x, y or time projection?
If you want to try this out, you can use the image , which has all 5 dimensions to work with.
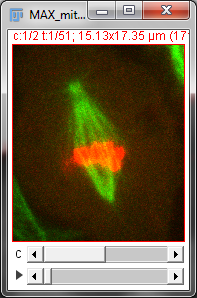
Max z-projection
|
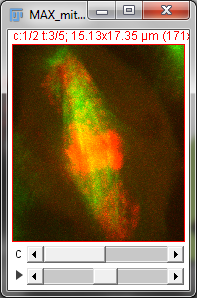
Max time-projection
|
Max x-projection
|
Note: Choose to avoid needing to re-download sample images every time you want them.
Answer
The command will also work on time series to make a time projection, assuming there are not extra z-slices present too. If there are, you can use or to switch the dimension names and trick ImageJ into doing what you want.
You can make x and y projections by running first, then making the projection.